Raw rows loaded
525,461
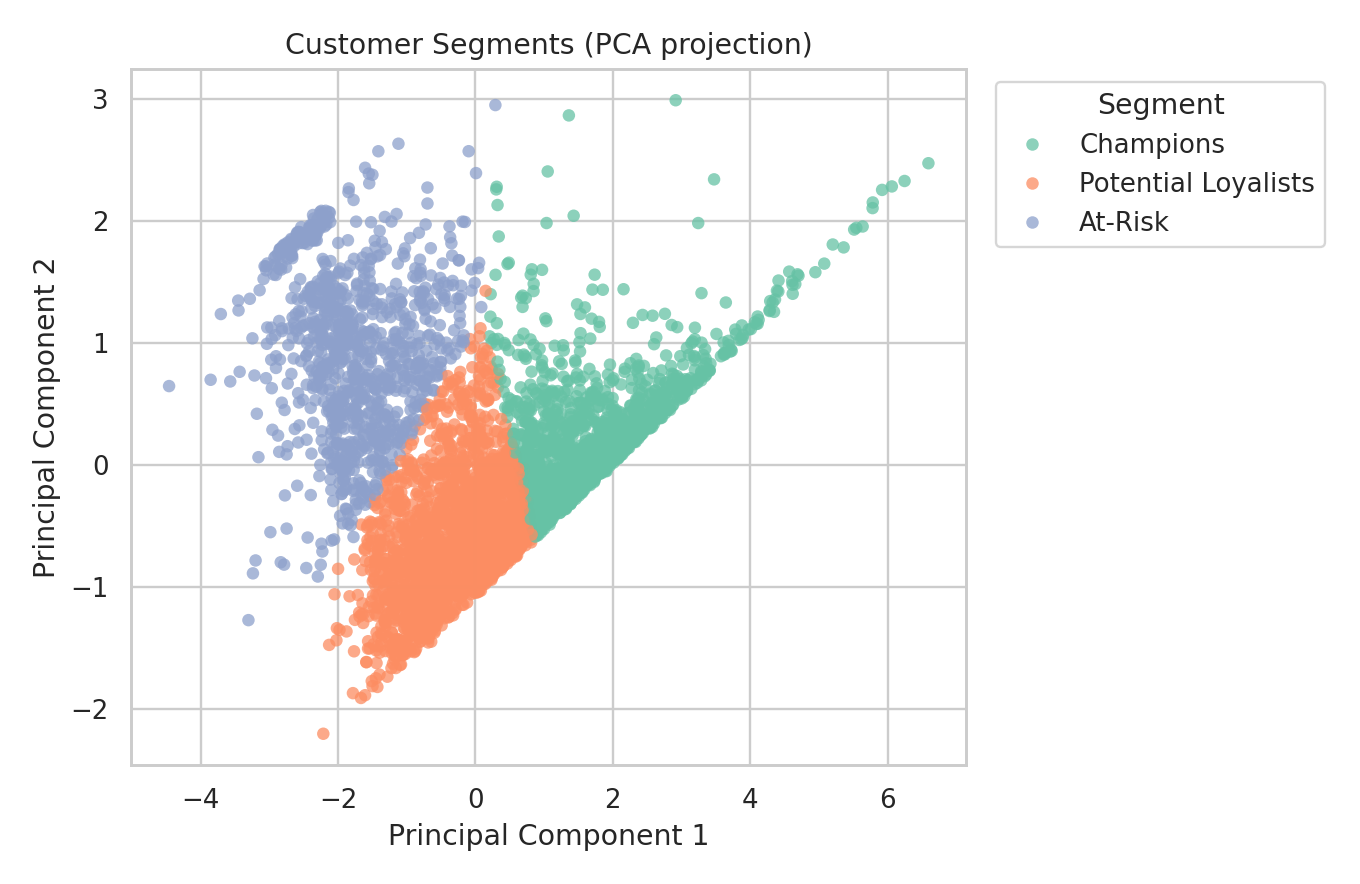
RFM-based clustering with KMeans baseline and GMM comparison
| Model | Silhouette Score | Interpretation |
|---|---|---|
| KMeans (k=3) | 0.4117 | Best baseline |
| GMM (k=3) | Run notebook cell for exact value | Secondary comparison |
| Cluster | Segment Name | Recency | Frequency | Monetary | Size |
|---|---|---|---|---|---|
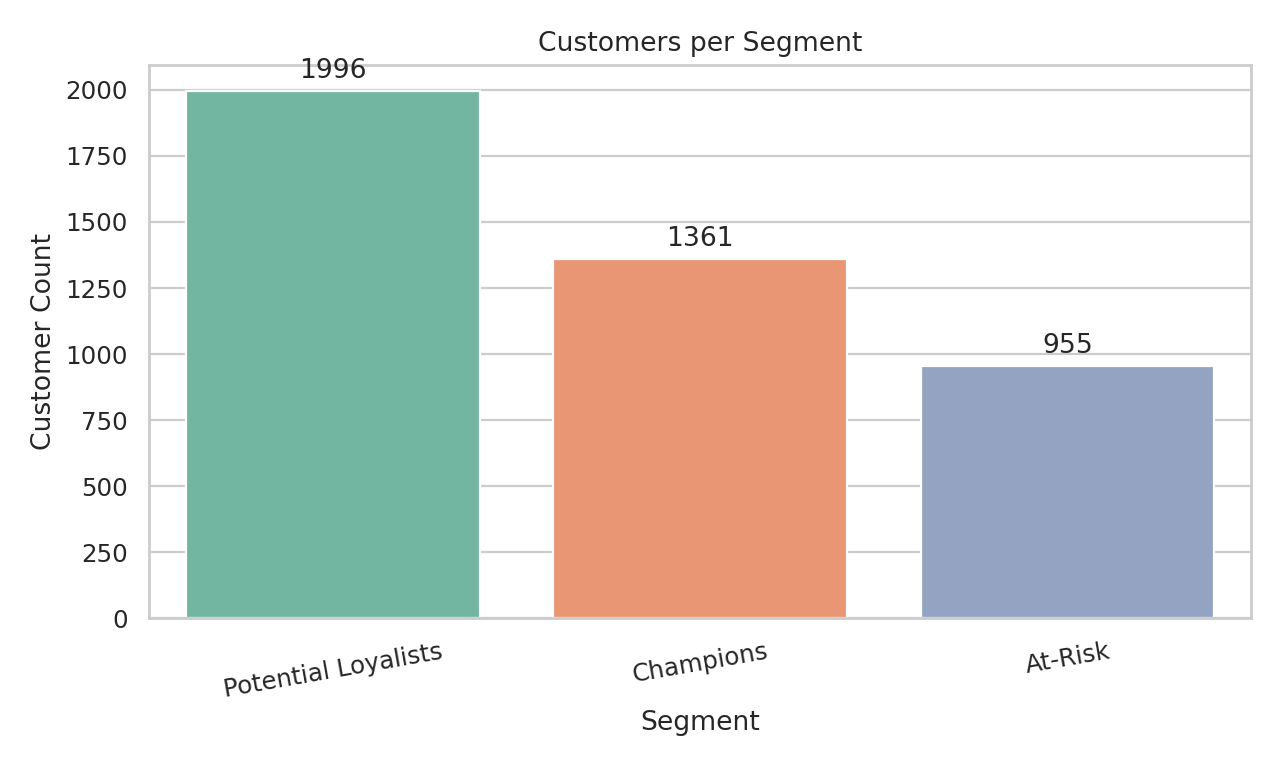
| 0 | Champions | 34.06 (low) | 2.18 (high) | 8.00 (high) | 1,361 |
| 1 | At-Risk | 249.76 (very high) | 0.85 (low) | 5.59 (low) | 955 |
| 2 | Potential Loyalists | 54.24 (mid) | 1.07 (mid-low) | 6.16 (mid) | 1,996 |
Customers per Segment
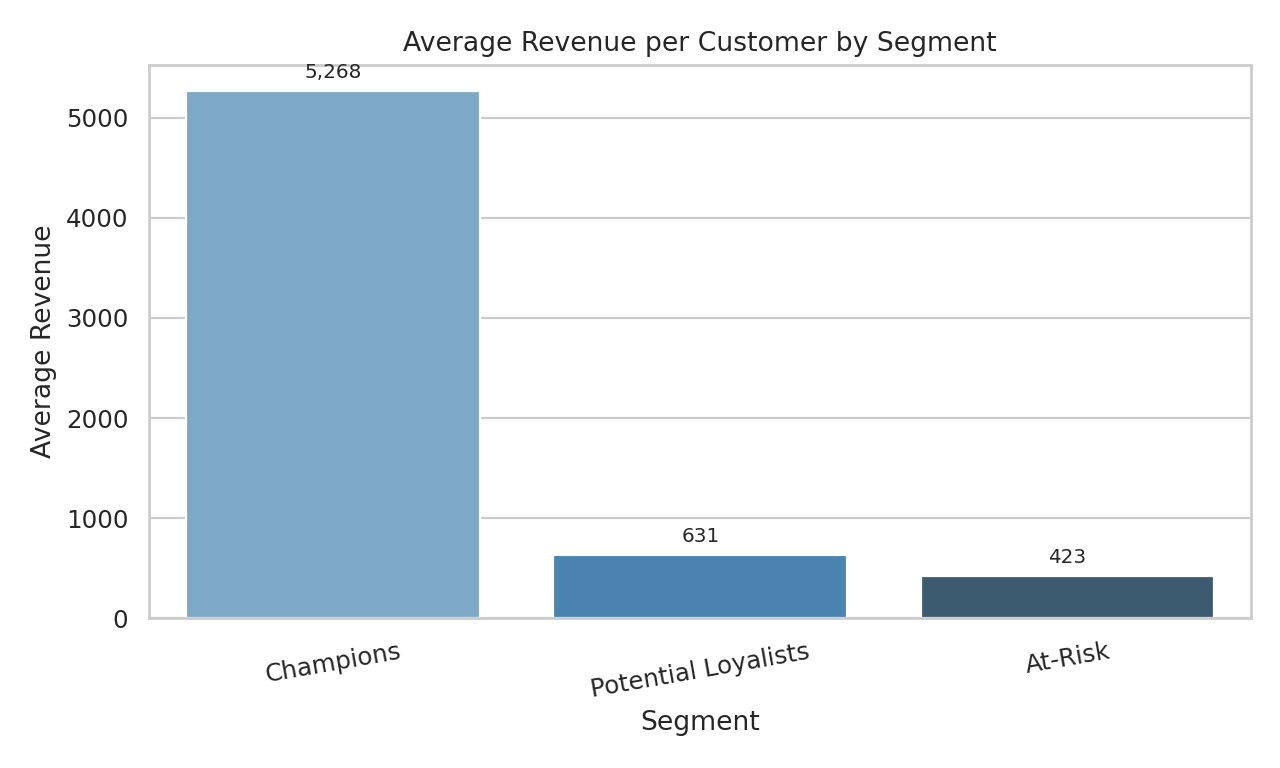
Average Revenue per Customer by Segment
Customer Segments (PCA projection)
notebooks/01_customer_segmentation_starter.ipynbdata/processed/customer_segments.csvenvironment.ymlNote: Frequency and Monetary values in clustering were log-transformed for modeling stability. Use the exported file for business-facing dashboards and campaign execution.